Access to Credit: How NYC Ranks and What it Means for Resiliency

Community Credit indicators rank credit access and credit stress around the country. Here’s how NYC’s boroughs rank and why it matters.
The Federal Reserve Bank of New York recently developed Community Credit indicators to rank credit access and credit stress in US states and counties. These indicators were created because researchers found a relationship between how many people in a community had access to credit at affordable rates and the community’s ability to recover from big shocks like Super Storm Sandy and the 2008 financial crisis.
The Fed’s observation follows the reality that credit allows people to borrow cash that can be spent on unforeseen expenses and temporary loss of income. So, when communities are credit wealthy, they are more stable and more resilient to economic, environmental, and public health shocks than credit poor communities.
The Indicators
The Community Credit indicators include the percent of adult residents with a credit file, revolving credit (like a credit card), high credit utilization (use more than 30% of their credit limit), subprime scores, and struggling or consistently delinquent payment history. And together, these indicators build a Credit Insecurity Index that can be compared across geographies and overtime.
Credit Index Security Ratings

From the Federal Reserve Bank of New York.
At the highest end of the ranking, credit-assured areas represent communities with the highest percentage of residents able to access credit at good rates and at any time. At the lowest end of the ranking, credit-insecure areas represent communities with the lowest percentage of residents able to utilize credit and the highest percentage of residents struggling with credit stress. How’s NYC Doing?
How’s NYC Doing?
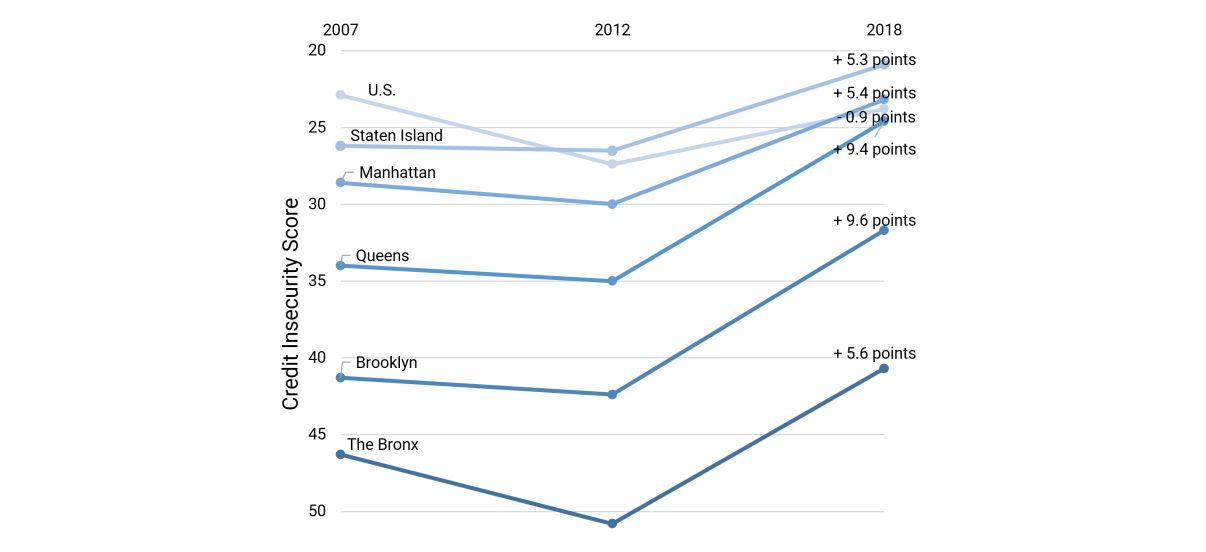
Overall, New York City ranks lower than the US average, but credit access has improved over the past decade. All boroughs improved their credit insecurity score from 2007 to 2018, and by large amounts. For the US, the credit insecurity score worsened by 0.9 points. Further, 814 counties (about 26% of all US counties) remained either “credit-at-risk” or “credit-insecure” in this time period. However, in NYC, Manhattan and Queens were able to lift themselves out of the bottom two tiers and each of the five boroughs improved their score by five or more points. This means more New Yorkers are able to access good credit, and as a result, community resilience is increasing.
Borough Credit Insecurity Index Scores Are Better Than Pre-Recession Scores
Source: Author calculations using FRBNY Credit Insecurity Data (Q4 2007, Q4 2012, Q4 2018)
Point increases are the changes in Credit Insecurity Score from Q4 2
This strong improvement is especially good news for the city because credit access has historically been low and still is in some communities. In 2007, not a single borough was ranked “credit-likely” or above, which requires a credit insecurity score of 23 points or below. But in 2018, two boroughs—Staten Island and Manhattan—are “credit-likely.” And Queens, now considered “mid-tier,” is only one point away from that ranking. Brooklyn also increased its ranking with a large 9.6-point increase from 2007 to 2018, but it is still vulnerable, moving only from “credit-insecure” to “credit-at-risk.” The Bronx is also still vulnerable, remaining in the “credit-insecure” range from 2007 to 2018, but the borough experienced notable improvements in credit access.
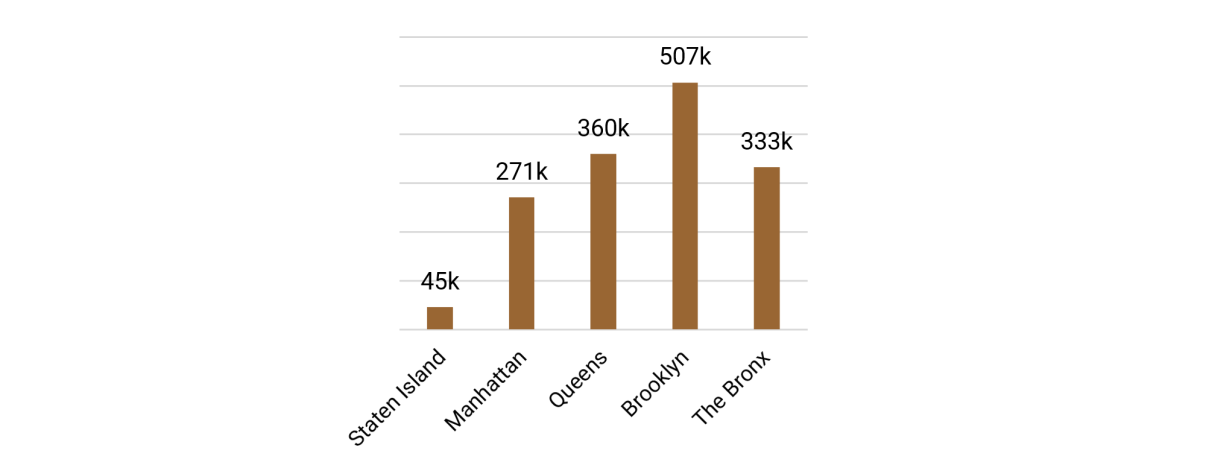
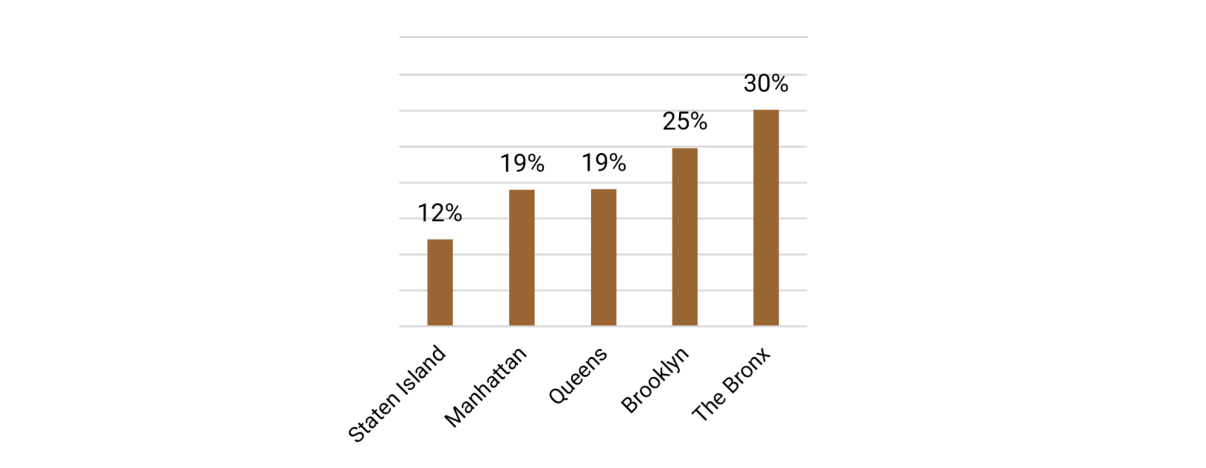
Across NYC, the main driver of lower community credit access is the high percentage of adults without a credit file. These adults do not have a credit file with any of the major credit agencies and are considered “credit invisible.” The percentage of NYC credit invisible residents is double the percentage of US residents—22% of New Yorkers do not have credit, compared to 11% of US residents. All of the boroughs, other than Staten Island, have the highest rates of credit invisible adults in the country.
Brooklyn Is Home to a Third of the 1.5 Million Adults Without a Credit File
Source: Author calculations using FRBNY New York City Credit Profile, Q4 2017 and ACS 1-year 2017.
The Percentage of Adults without a Credit File Is Highest in the Bronx
Source: Author calculations using FRBNY New York City Credit Profile, Q4 2017 and ACS 1-year 2017.
All other components of the credit insecurity index are better in NYC than the US average. A higher percentage of New Yorkers have low credit utilization (less than 30% of their credit limit), and a smaller percentage of New Yorkers have subprime credit scores compared to the rest of the country. NYC also has the same percentage of credit users with prime credit scores, on time payment, and good credit history as the rest of the country.
In Most NYC Zip Codes, More That 15 Percent of Residents Are Credit Invisible
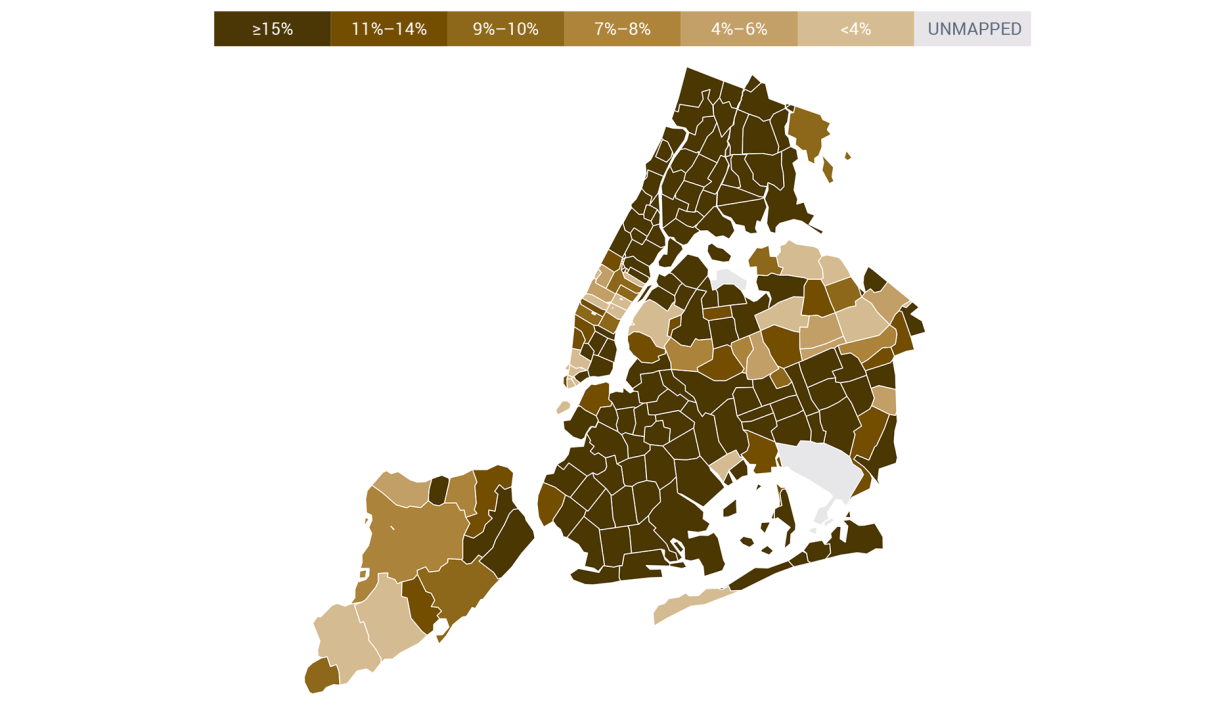
New York City map not included. Source: FRBNY 2018 New York City Credit Profile, pg. 33.
So, if access to credit was not a component of the Credit Insecurity Index, NYC would likely be ranked Credit-Assured. And, if the percentage of credit invisible New Yorkers matched the US average (11%), NYC would be ranked Credit-Likely—the US’s current ranking. The big effect of credit access on community credit wealth in NYC highlights a unique inequality problem where the credit invisible live alongside the credit wealthy.
However, citywide credit wealth doesn’t mean community credit access isn’t a problem. Credit-poor communities do exist in the city and they are concentrated in the Bronx, eastern Queens, and eastern Brooklyn. They represent communities with low credit access, debt stress, and low credit capacity. Meaning a high percentage of adults cannot access credit with favorable terms due to a combination of a short credit history, high credit utilization, subprime credit scores, and struggling payment history.
High Credit Stress is Concentrated - Zip codes rank weakest in nation for:
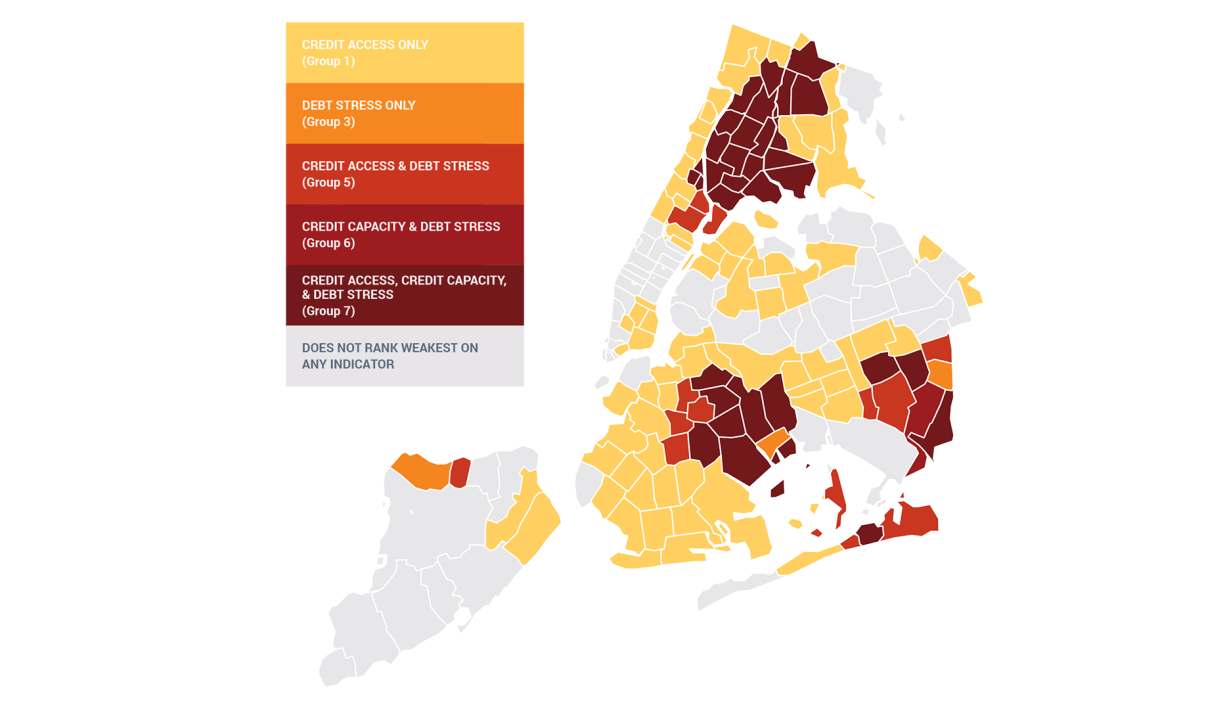
New York City's 118 Credit-Constrained Zip Codes, 2017 Q4. Source: FRBNY 2018 New York City Credit Profile, pg. 72
Still, the data show that community credit in these zip codes is improving. The Bronx increased its credit insecurity score by 10.1 points between 2012 and 2018, and Brooklyn increased its score by 10.7 points, representing some of the highest county-level increases in the country. Brooklyn and the Bronx also have the highest percent of adults with improving payment history when compared to the other boroughs.
In all, with lowering credit insecurity scores, the NYC credit story is improving. The city is also unique in its credit wealth, because in NYC, the credit wealthy and the credit invisible support the same community. And even though credit stress is low for the city overall, like most cities, severe credit stress exists in concentrated areas. With these three credit factors, it will be interesting to see how well the Federal Reserve’s hypothesis holds up: that community credit can gauge and benchmark the economic resiliency of communities in New York City.
For more information on the data used in this report, how the credit insecurity index is constructed, and credit insecurity rankings for NYC and across the US, please consult the Federal Reserve Bank of New York’s Unequal Access to Credit publication and New York City 2018 Credit Profile publication.
Learn more about NYCEDC’s Economic Research & Policy group at edc.nyc/Insights and contact the team at [email protected].
SOURCES
1. “Community Credit: A New Perspective on America’s Communities.”
2. The credit constraining outcomes or “Stress” component of the Credit Insecurity Index accounts for 9.2 and 9.9 points of Queens’s and Brooklyn’s respective scores. The “Access” and “Stress” components of the Credit Insecurity Index are unknown for the other boroughs.