Density and its Effect on COVID-19 Spread

How much does population density really affect the spread of COVID-19? (Spoiler: not much and it could even be a good thing.) So, what else is at play? Here’s what the literature and data tell us.
The World Bank recently released findings regarding the role of urban density in the spread of COVID-19 based on evidence from China.1 Although some commentators equate higher population density with higher rates of infection and vice-versa,2 the World Bank data suggest that there’s no significant causality between the two. Further, using neighborhood testing data from New York City, our analysis amplifies the existing literature and confirms that density is only one of many factors that influence vulnerability to COVID-19.
Density Matters, But Not Much
In theory, population density increases the contact rate of an individual, thereby increasing the reproduction number (also called R by epidemiologists) of the virus and leading to larger outbreaks. For example, prisons and factories have emerged as outbreak locations throughout this pandemic. County-level analysis also finds a positive correlation between population density and the number of confirmed cases, but the effect is relatively small.3
Other evidence, however, indicates that density is not the only factor. For example, some of the world’s most densely populated cities in East and Southeast Asia have had very low levels of infection compared to more sprawling cities in the US. Despite boasting high population densities, international cities like Seoul, Tokyo, and Hong Kong yield a combined total of 35,064 confirmed cases, far below NYC’s total count.4 Within the US, outbreaks have occurred in rural and suburban counties, not just big cities (Figure 1). Similarly, a recent study of COVID-19 cases in Chicago found no correlation between population density and infection rates.5
Figure 1. COVID-19 United States Cases by County
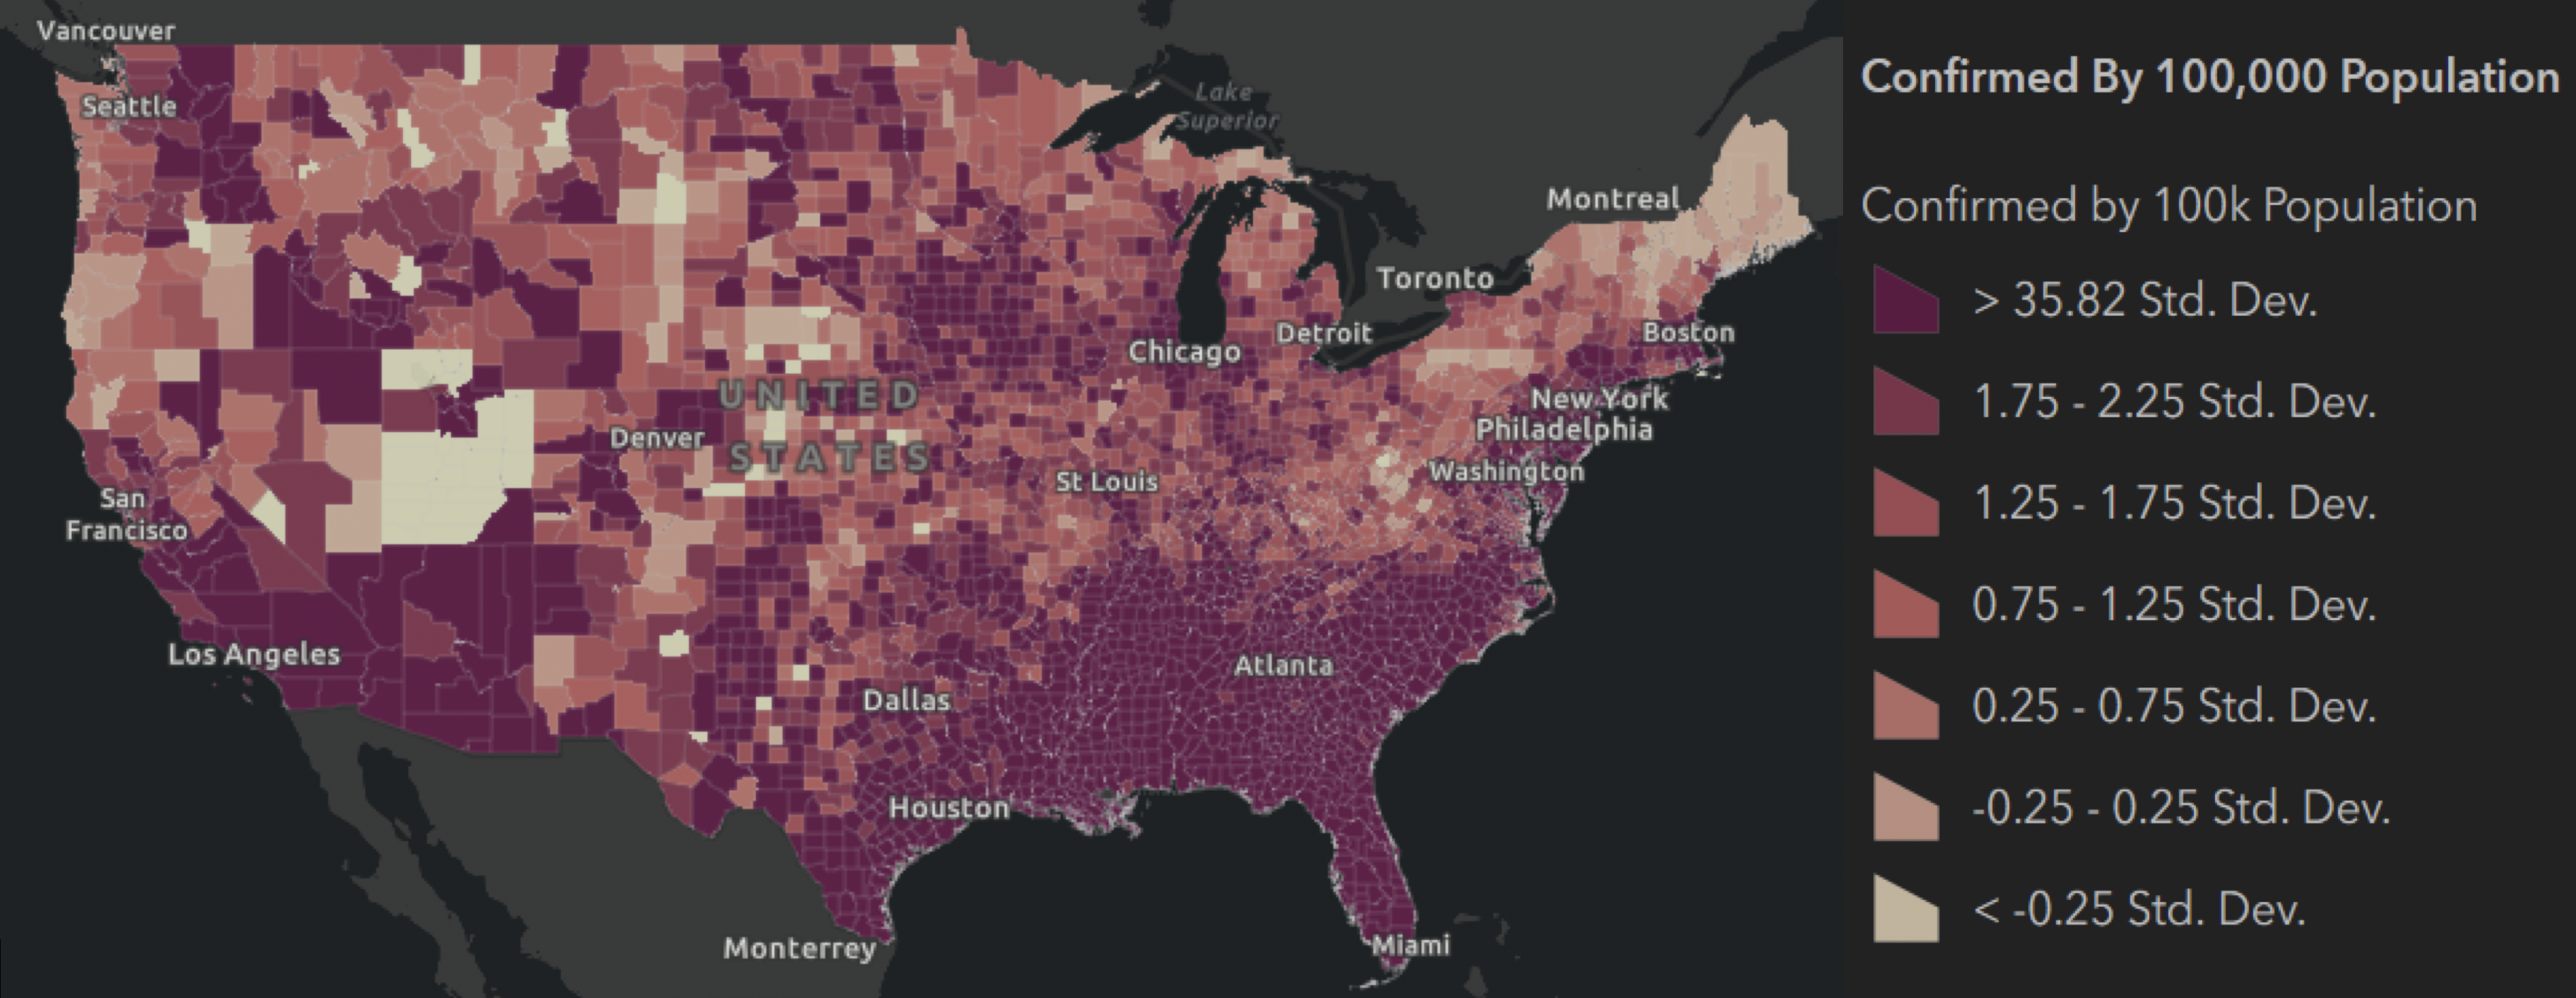
Map visualization of data from September 25, 2020, John Hopkins University
A correlation analysis of NYC neighborhoods reveals similar findings. In fact, the association between density and cases per 100,000 at the borough level is negative (-0.63), which, although too small to conclude a negative correlation, does go against the idea that higher density is associated with more infections. For example, despite being the most densely populated borough in the city, Manhattan has been relatively spared compared to its neighbors (Table 1). And this can’t be explained away by the borough’s large population outflows early in the crisis—and resulting decrease in density—which don’t change the conclusion. Meanwhile, Staten Island has the second-highest number of cases per 100,000 people but the lowest population density of the five boroughs.
Table 1. Confirmed Cases and Density by NYC Borough
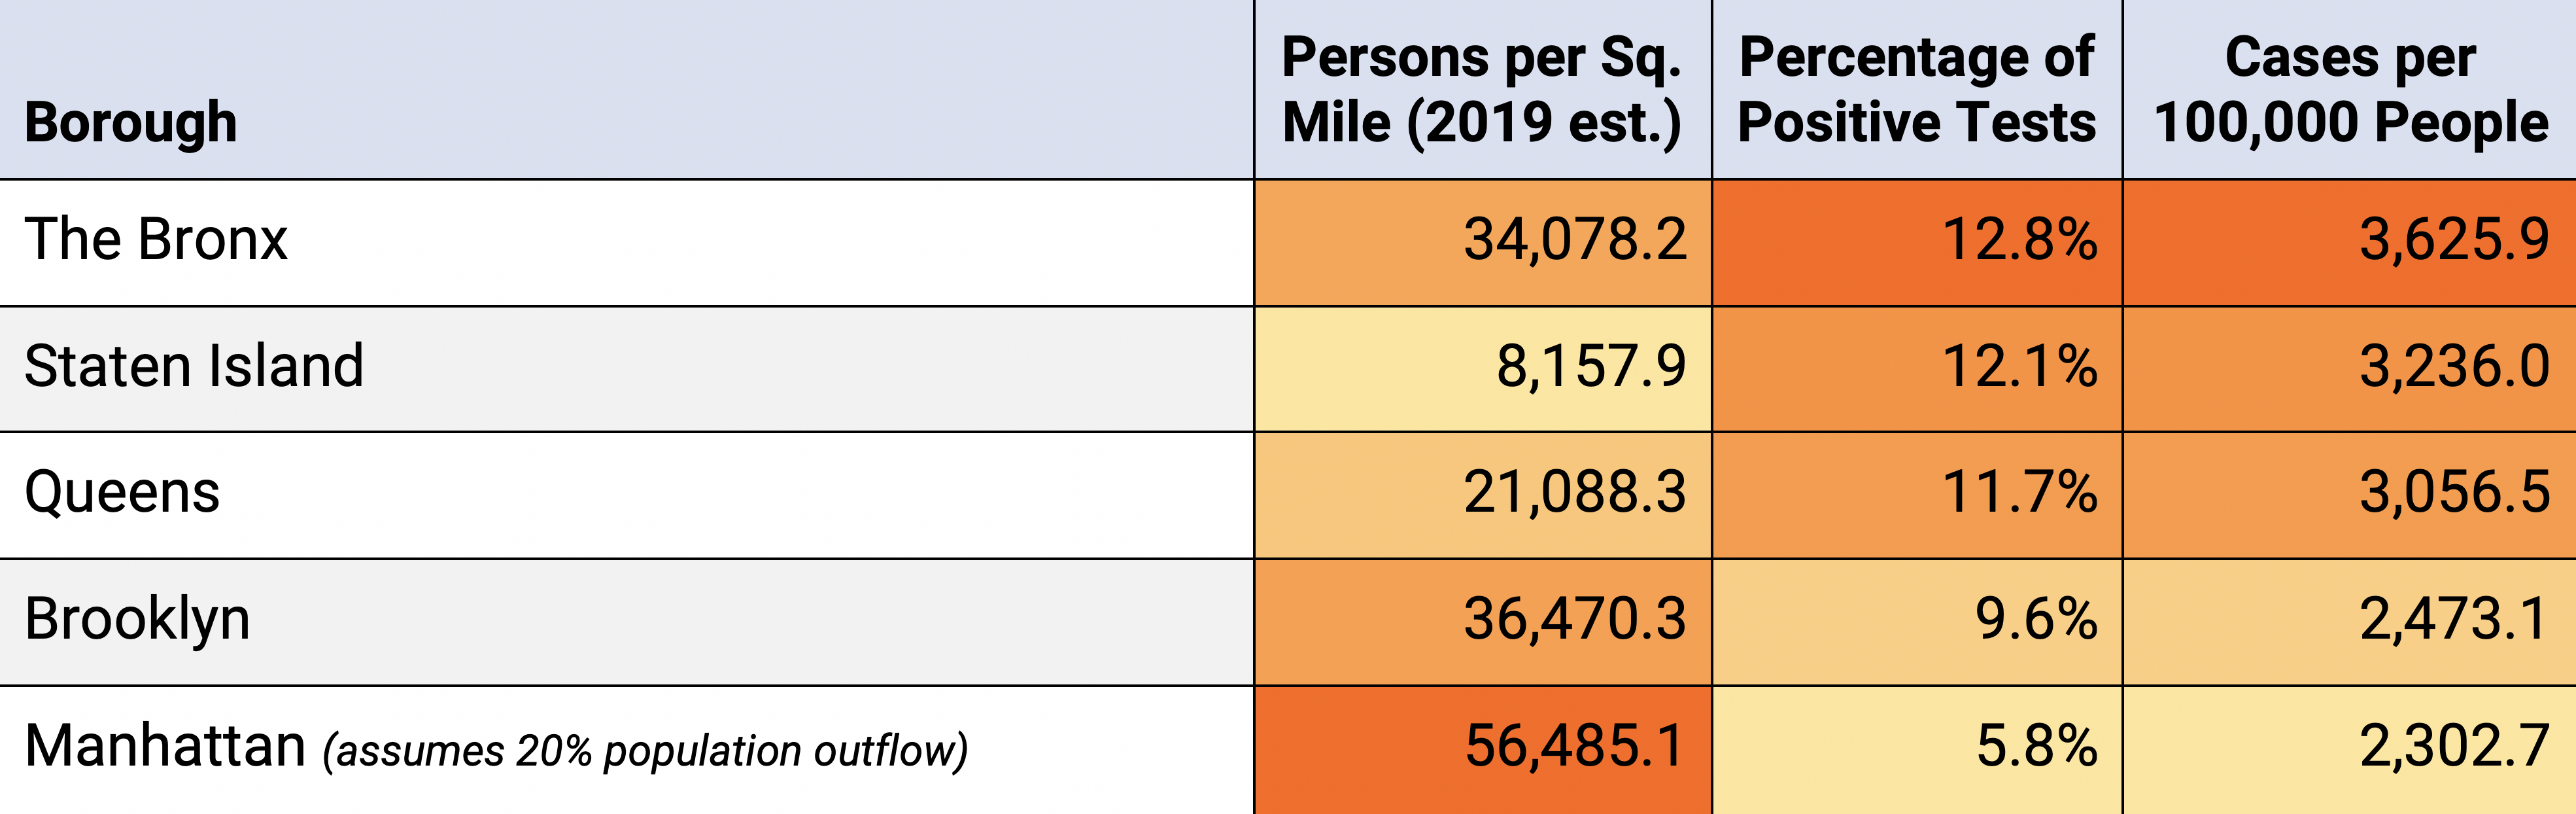
Population estimates from NYC Department of Health and Mental Hygiene, based on estimates from the U.S. Census Bureau and NYC Department of City Planning; Cases data from NYC Department of Health and Mental Hygiene as of September 25, 2020. Note: According to New York Times, the estimated outflow in Manhattan ranges from 12.9% to 18.6%. But an outflow at this magnitude is not large enough to affect the results–Manhattan is still the borough with the highest population density and lowest infection rate in NYC even with a 20% population loss. Percentage of positive tests equals to number of confirmed cases divided by number of COVID tests and therefore already accounts for the population loss.
High Density Can… Help?
In fact, some literature points out that density is also a strength in coping with COVID-19.6 First, cities are economic centers that support high-quality infrastructure, which, in this case, means faster emergency response times, better hospital staffing, and a greater concentration of intensive-care beds and other healthcare resources. Second, service redundancies in urban areas also make communities more resilient during disasters, as people are more likely to find alternatives within walking distance or through delivery service when travel becomes an issue.
Rather than viewing density as an inherent danger, our society should use this crisis as an opportunity—to rethink urban resilience from a public health perspective and view density as a strength.
Crowding is the Real Enemy
Research highlights that crowding—measured as people per room or housing unit—can better explain the ease of transmission of the virus. In that regard, it’s not population density, but specific crowded enclosed areas like dormitories, open-plan offices, places of worship, hospitals, public transport, and planes that are especially dangerous. And this isn’t only due to the number of people, but also to behaviors and circumstances specific to these areas.7 For example, COVID-19 spread rapidly throughout Albany, GA, following two large funerals where there was not only close physical contact, but singing, which projected viral particles especially far and at a high volume throughout the crowded spaces.8
Crowding at home provides another hotbed for the spread. Neighborhood-level data in NYC reveal a positive correlation (of 0.46) between occupants per room and cases per 100,000 people. But despite this general trend, some “crowded” neighborhoods have a relatively low number of cases per 100,000 households (Table 2), suggesting that there are other factors that come into play, such as educational attainment and income level. To this point, our analysis of zip code data using Zip Code Tabulation Area (ZCTA) shows that areas with higher median income levels have fewer confirmed cases (Table 3).
Table 2. Top and Bottom 10 NYC Neighborhoods by Household Crowding
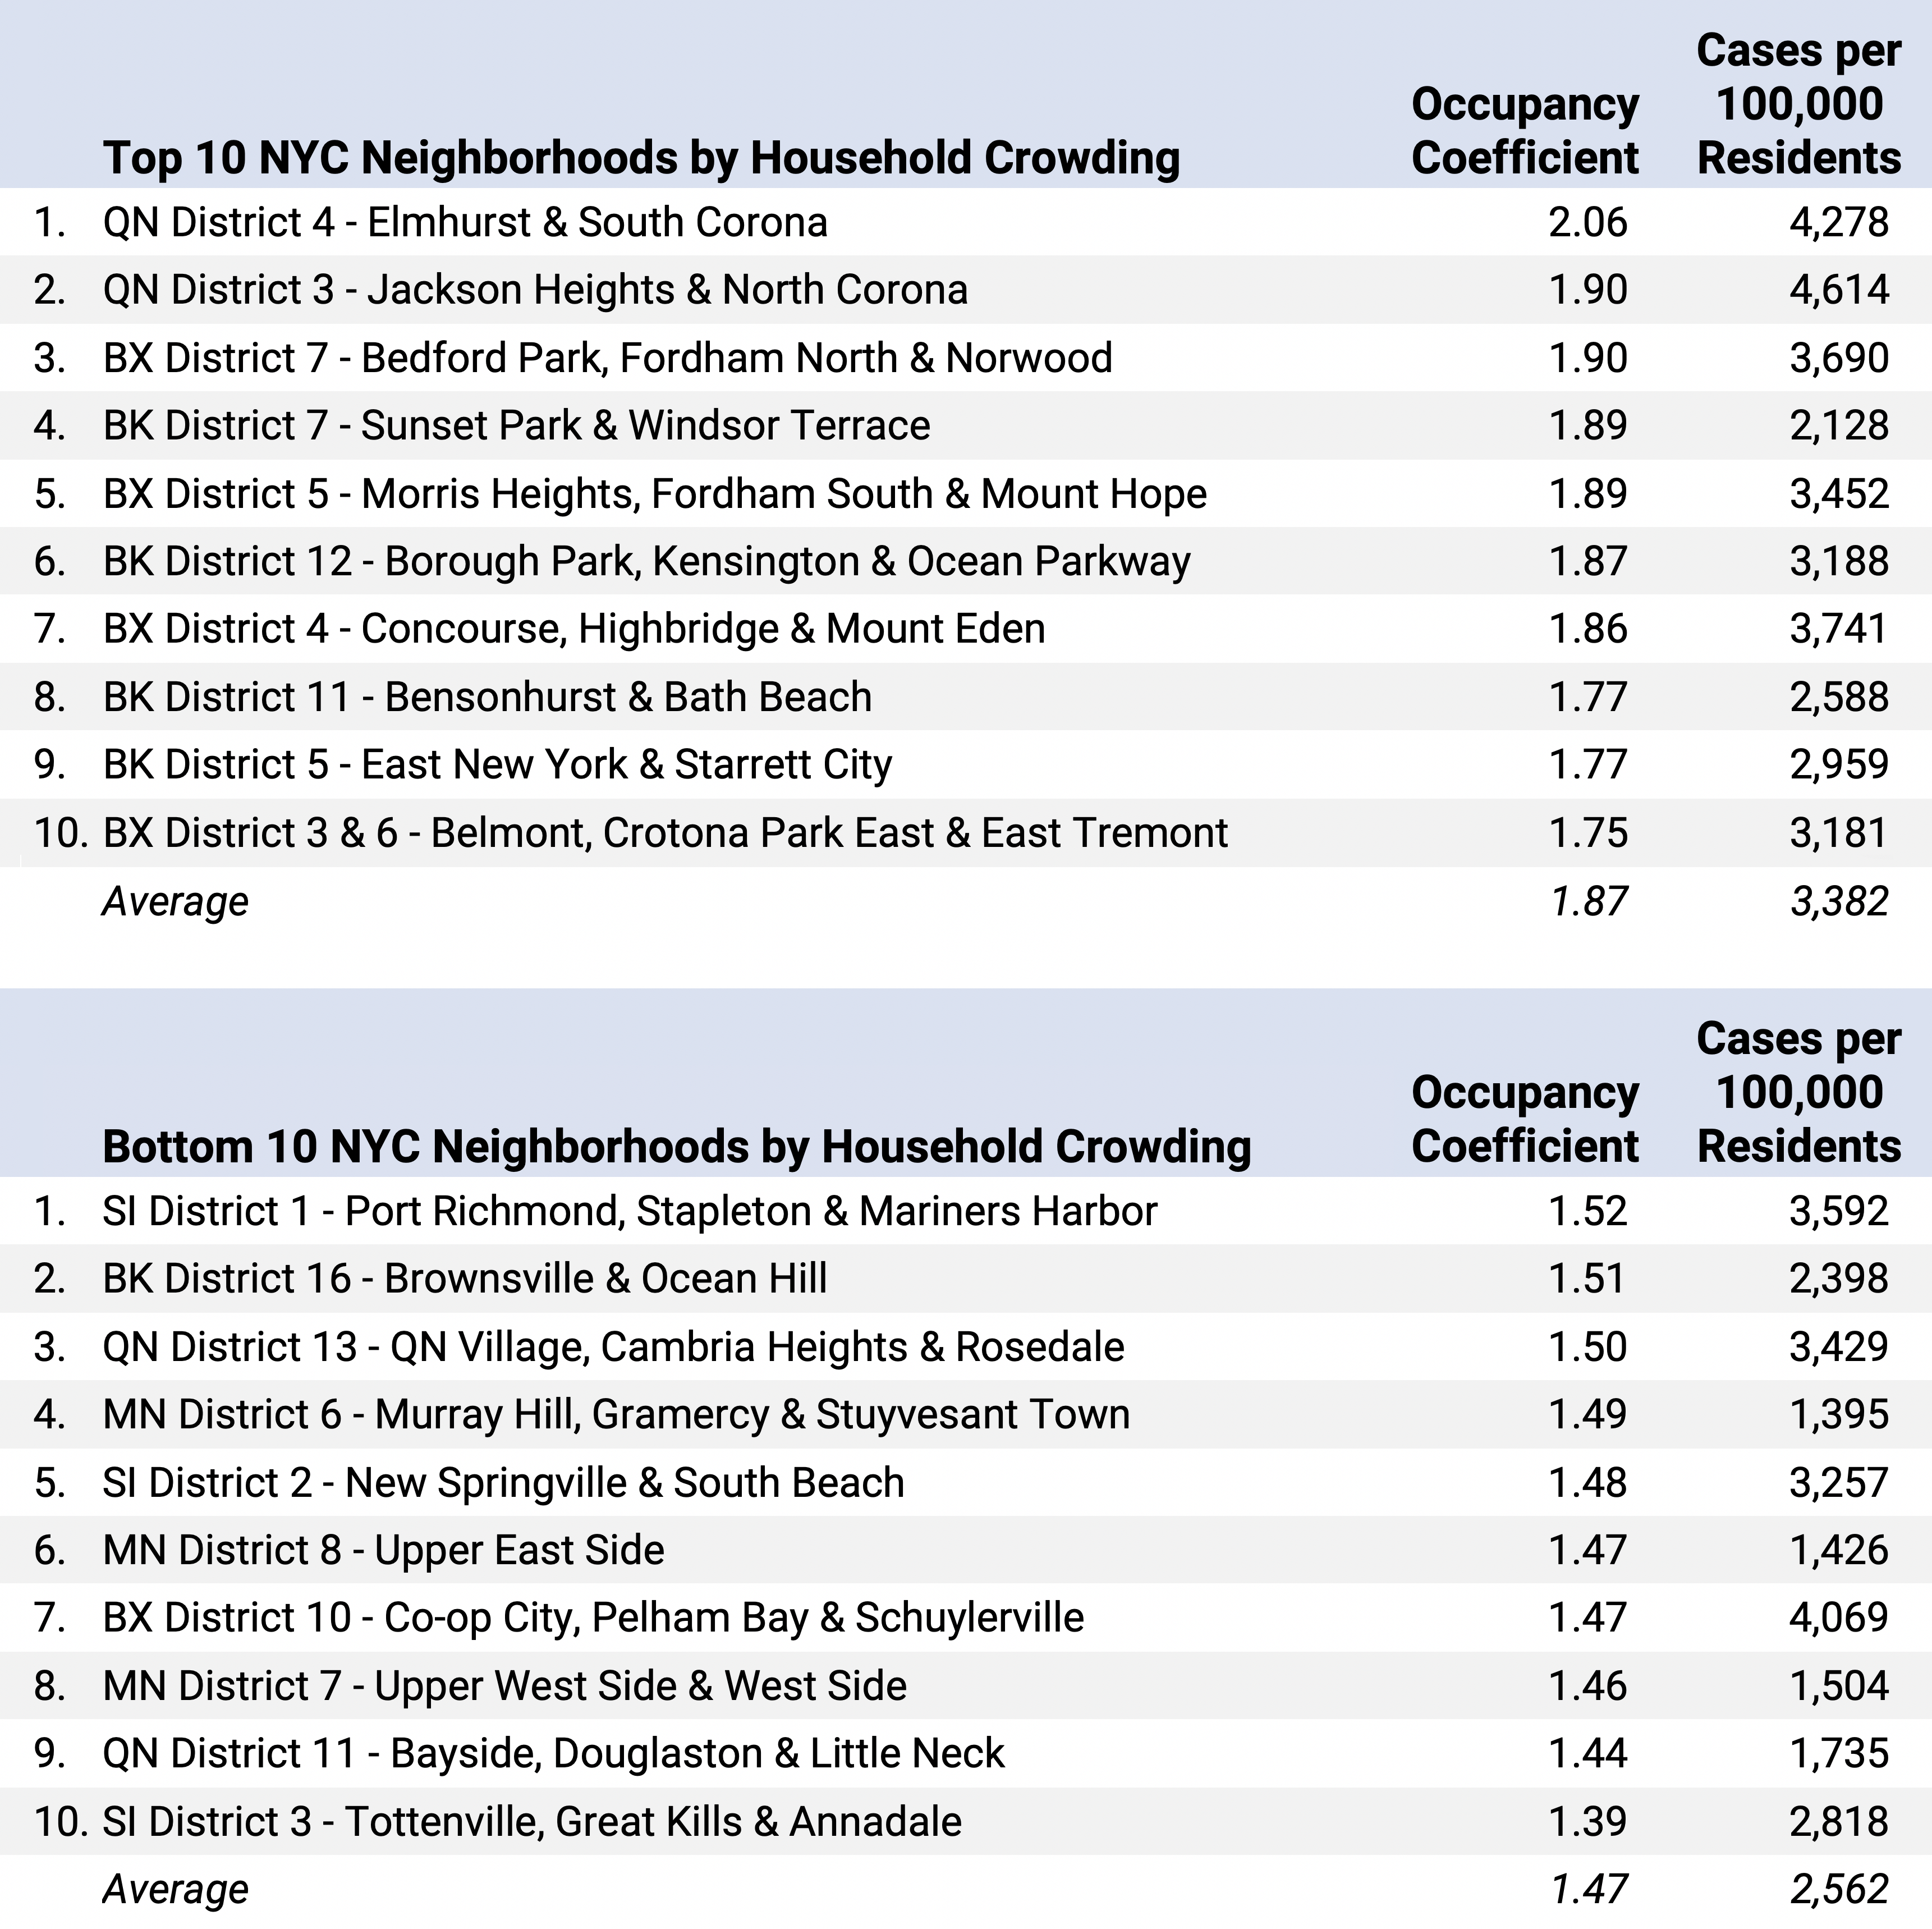
Population estimates for occupancy coefficient from ACS 2014-2018 5-year estimates; Testing data as of September 25, 2020. Note: Occupancy coefficient is a measure of how crowded a district is relative to a base level. It is measured by assigning weights to ACS occupancy levels (under 0.5 persons per room; 0.5 to 1 person per room; 1.01 to 1.5 persons per room; 1.51 to 2 persons per room; over 2 persons per room).
Table 3. Median Income Brackets and Number of Positive Cases, by NYC Zip Code
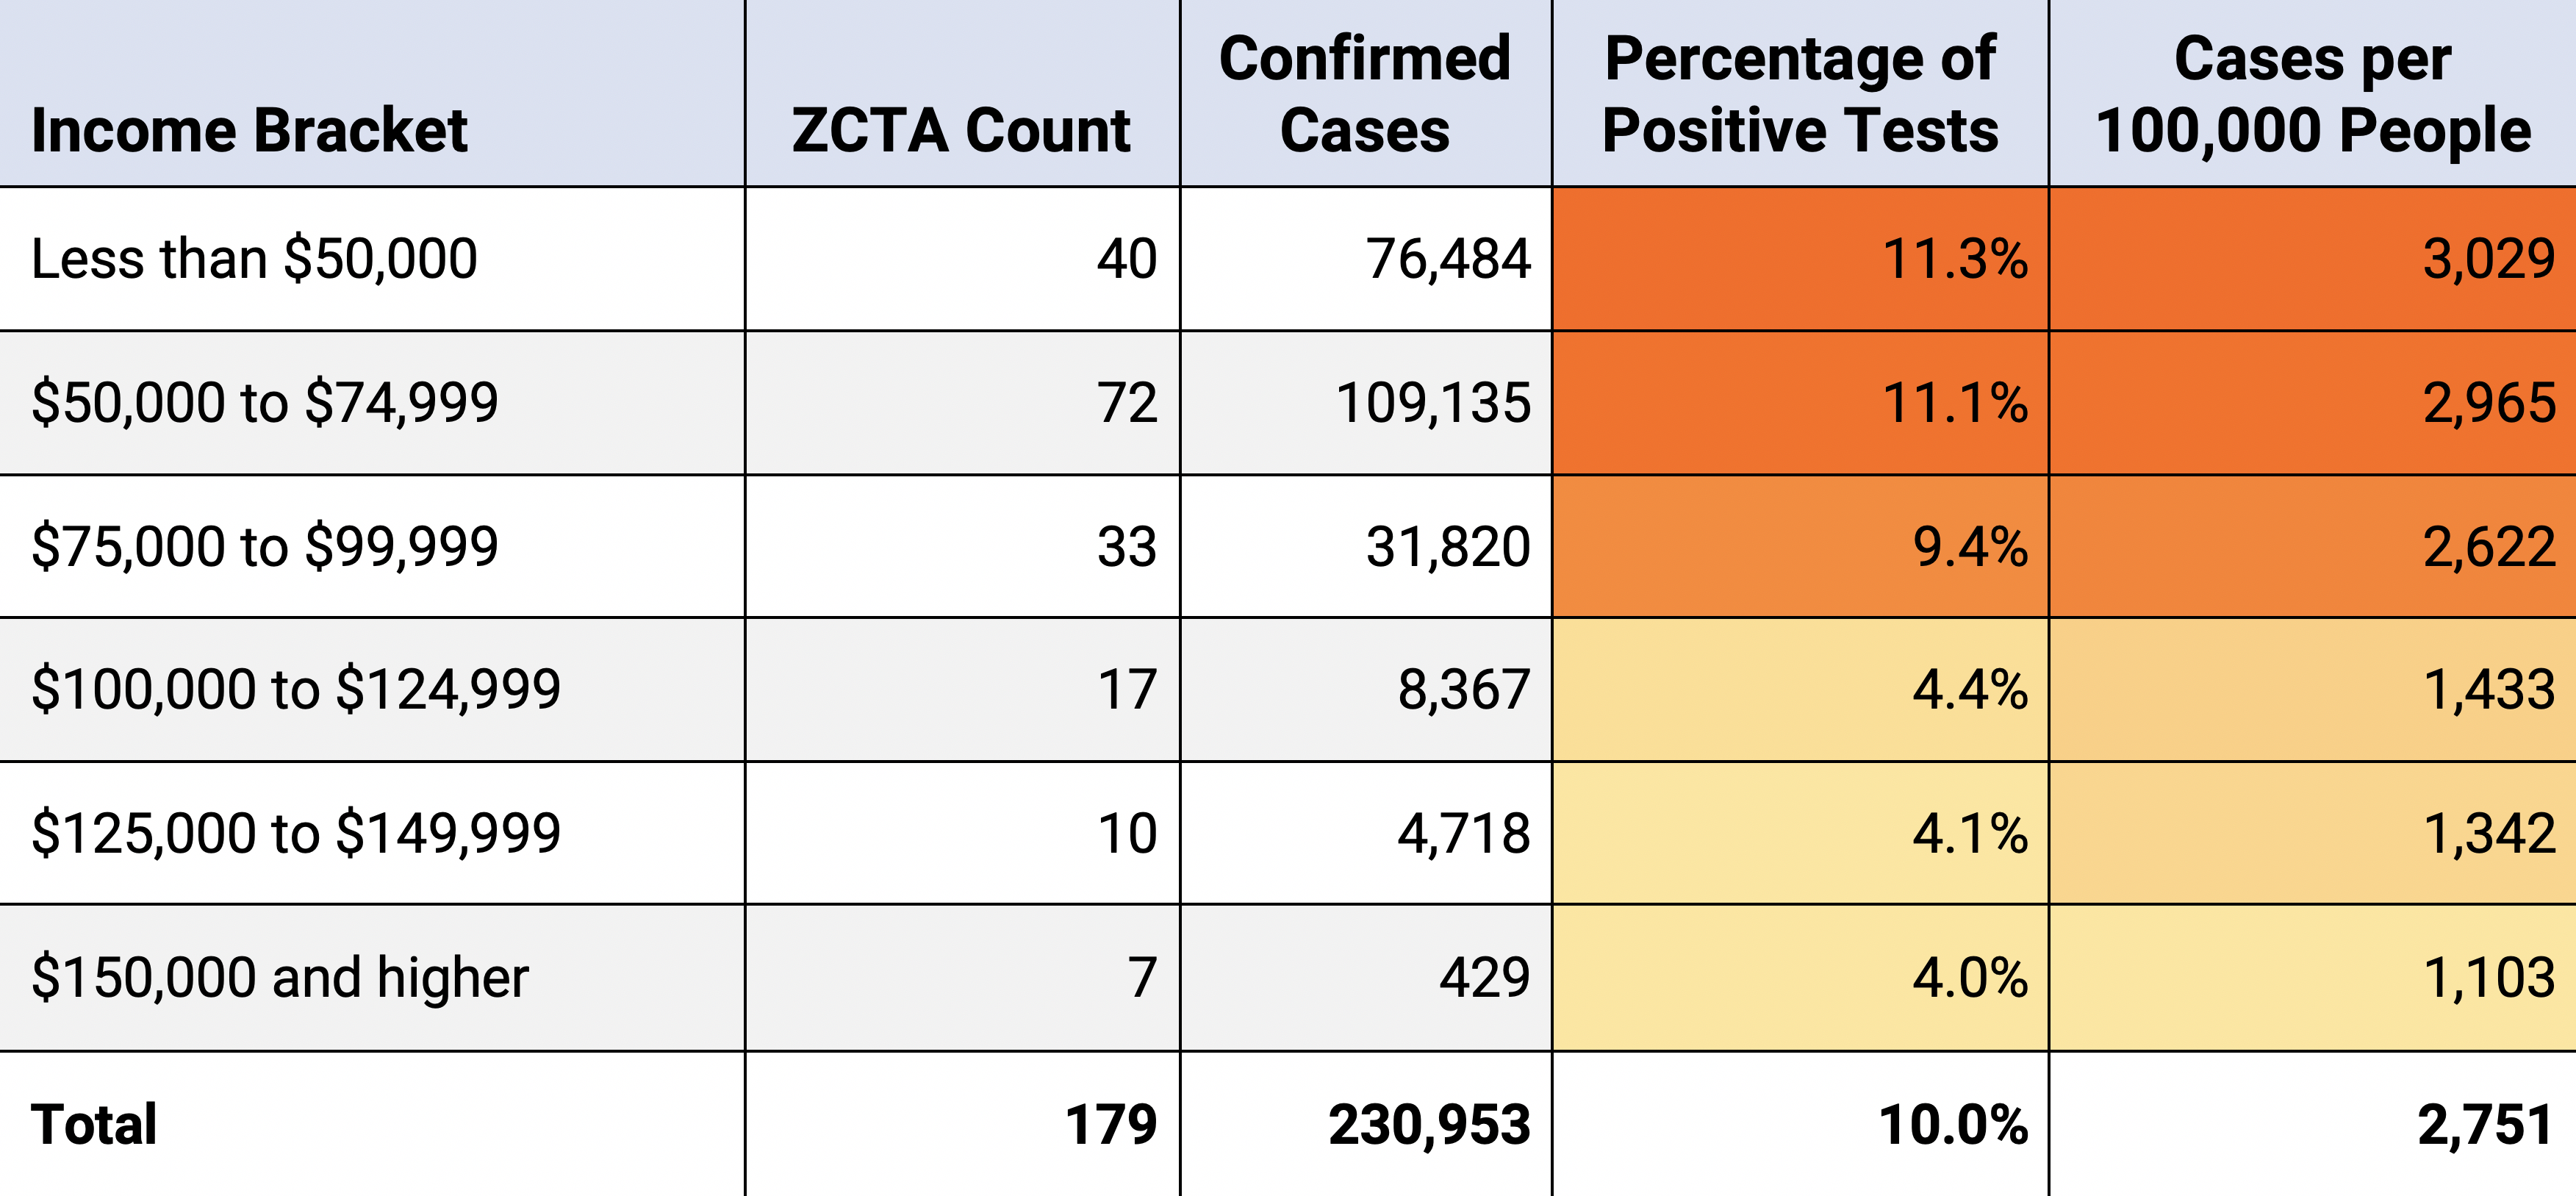
Median income estimates from ACS 2014-2018 5-year estimates; Testing data as of September 25, 2020.
Don’t Ignore Timing
Apart from crowding and socio-economic factors, studies have shown that the timing of when the virus hit a city is also important. While it might appear that density caused cities to become early hotspots, researchers argue that dense urban areas are also travel hubs that are more likely to attract the “first bolts of lightning.”9 Furthermore, cities hit first by the virus have a steeper learning curve in responding, with fewer models and examples from which to learn and draw best practices. This, in turn, leads to slower and less-effective initial responses and a bigger outbreak. Simply put, places hit early by the virus have more cases, especially at first.
An Opportunity
Given this analysis and review, rather than viewing density as an inherent danger, our society should use this crisis as an opportunity—to rethink urban resilience from a public health perspective and view density as a strength to build a better public health system that can help us cope with future challenges.
Learn more about NYCEDC’s Economic Research & Policy group at edc.nyc/Insights. Contact the team at [email protected].
SOURCES
1. Wanli Fang and Sameh Wahba, “Urban Density Is Not an Enemy in the Coronavirus Fight: Evidence from China” - The World Bank, April 20, 2020
2. Henry Olsen, “The United States Might Have a Secret Weapon Against Coronavirus” - The Washington Post, March 19, 2020
3. Jason Barr and Troy Tassier, “Are Crowded Cities the Reason for the COVID-19 Pandemic?” - Scientific American, April 17, 2020
4. Case data from the Korea Centers for Disease Control and Prevention, Hong Kong Geodata Store, and the Japan COVID-19 Coronavirus Tracker as of August 18, 2020.
5. Haru Coryne, “In Chicago, Urban Density May Not Be to Blame for the Spread of the Coronavirus” - ProPublica Illinois, April 30, 2020
6. Emily Badger, “Density Is Normally Good for Us. That Will Be True After Coronavirus, Too” - New York Times, March 24, 2020
7. Elek Pafka, “As Coronavirus Forces us to Keep Our Distance, City Density Matters Less Than Internal Density” - The Conversation, May 12, 2020
8. Ellen Barry, “Days After a Funeral in a Georgia Town, Coronavirus ‘Hit Like a Bomb’” - The New York Times, March 30, 2020
9. Jason Barr and Troy Tassier, “Are Crowded Cities the Reason for the COVID-19 Pandemic?” - Scientific American, April 17, 2020