
New York City has a vibrant civic life. But voter turnout in New York City elections is abysmal. In 2021, just 23% of registered voters participated in the general election, even though every local elected official, including the Mayor, was on the ballot.1 Indeed, while the city has over 4.7 million active registered voters, only around 1 million of them voted in the 2021 mayoral election.2
Some elections have even lower turnout. In the 2023 City Council elections, a member won a contested Democratic primary with just 2,126 votes3 in a district with over 35,069 registered Democratic voters and approximately 146,495 total voting-age residents.4 Just 6% of registered Democrats and 1.45% of all voting-age residents in that district selected the eventual councilmember.

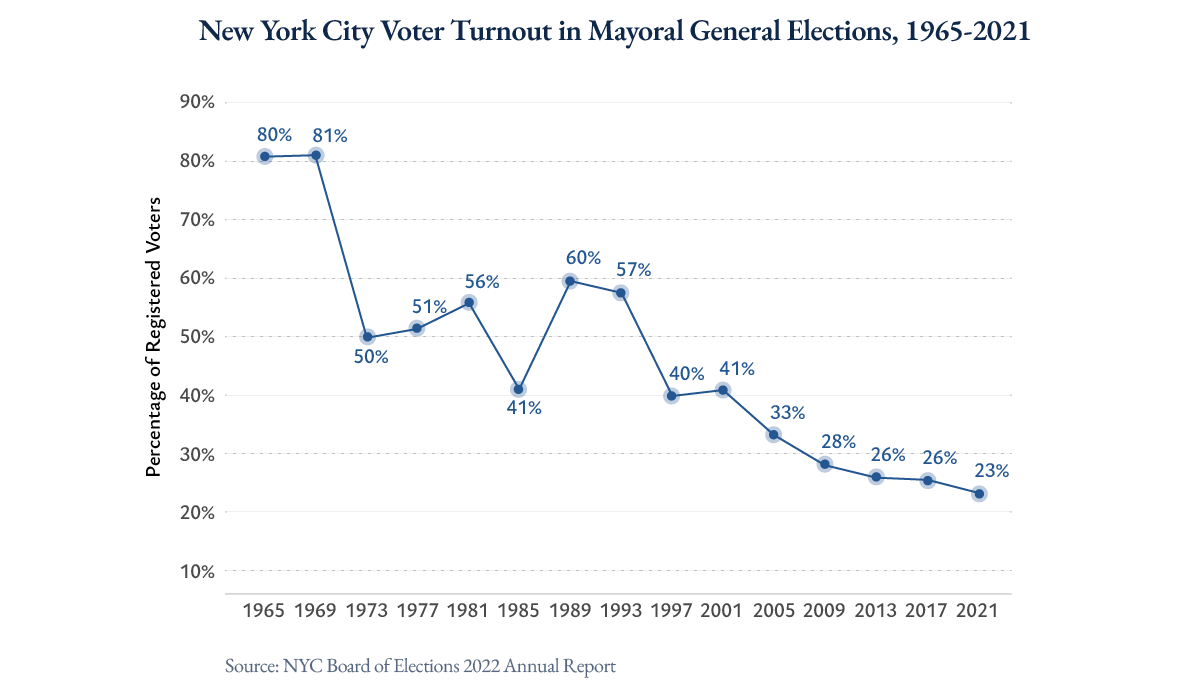
This problem is not new. New York has, for decades, suffered from chronic voter disengagement.
Although turnout levels were consistently above 50% throughout the 1970s and 1980s, participation has steadily declined since then. Registered voter turnout has not exceeded 40% in a mayoral election since 2001 and has been below 30% in every mayoral election since 2009.5
While many New Yorkers are registered to vote, few consistently turn out.6 Turnout is particularly low among young people.7 In the 2021 mayoral elections, turnout among eligible voters was lowest for the 18-29 age group and was only above 30% for individuals 60-69 and 70-79.8
Turnout by Age in 20219
| Age | June Primary | November General |
| 18-29 | 17.9% | 11.1% |
| 30-39 | 21.7% | 16.3% |
| 40-49 | 24.0% | 22.1% |
| 50-59 | 28.8% | 28.7% |
| 60-69 | 35.3% | 35.5% |
| 70-79 | 37.7% | 37.9% |
| 80 & Up | 23.2% | 23.2% |
Within New York City, turnout is especially low in minority communities. The ten Community Districts with the lowest turnout percentages in the 2021 primary election were all majority-minority (meaning a majority of voters are non-white). Comparatively, of the ten districts with the highest turnout percentages in the 2021 primary election, seven were majority white. And the top five highest turnout districts were all majority white. These dynamics illustrate that the New York City electorate does not fully represent the breadth and diversity of its people.
At the time of publication, the Commission has received more written testimony calling for election reform than any other subject.

Community District Profiles: Ten Lowest Turnout in 2021 Primary Election10
| Community District | Turnout % | % Asian | % Black | % Hispanic | % White |
| BX01 | 14.0% | 0.4% | 27.2% | 67.9% | 2.2% |
| BX06 | 14.1% | 0.6% | 30.3% | 62.7% | 3.2% |
| BX02 | 14.6% | 0.4% | 27.2% | 67.9% | 2.2% |
| BX03 | 15.0% | 0.6% | 30.3% | 62.7% | 3.2% |
| BX05 | 15.9% | 4.6% | 13.1% | 73.1% | 7.2% |
| BX07 | 16.9% | 0.7% | 30.3% | 64.7% | 1.2% |
| BX04 | 17.7% | 1.6% | 29.0% | 63.7% | 4.2% |
| QN10 | 17.9% | 22.3% | 13.9% | 23.8% | 19.5% |
| BK13 | 18.2% | 13.1% | 14.8% | 19.4% | 49.1% |
| BK11 | 18.4% | 41.3% | 1.6% | 15.9% | 38.9% |
Community District Profiles: Ten Lowest Turnout in 2021 Primary Election11
| Community Distrcit | % Turnout | % Asian | % Black | % Hispanic | % White |
| BK06 | 44.3% | 8.8% | 7.0% | 14.0% | 62.5% |
| MN07 | 41.6% | 10.2% | 6.8% | 15.9% | 61.7% |
| BK02 | 40.3% | 10.2% | 15.8% | 12.1% | 55.5% |
| MN02 | 37.6% | 16.1% | 3.7% | 9.2% | 65.8% |
| MN08 | 36.9% | 11.5% | 3.6% | 8.9% | 72.0% |
| BK08 | 35.4% | 4.0% | 44.5% | 13.5% | 30.7% |
| MN06 | 35.0% | 19.2% | 4.5% | 7.9% | 62.8% |
| MN04 | 34.3% | 16.2% | 5.6% | 20.9% | 51.5% |
| BK07 | 32.3% | 24.6% | 2.4% | 40.7% | 28.3% |
| BK09 | 32.2% | 3.3% | 46.9% | 13.0% | 28.6% |
At hearings, experts and members of the public have made the case for several reforms intended to broaden participation in local elections. Some have called for moving New York City’s local elections from odd-years to even-years, when turnout is far higher. Others—citing models from California, Alaska, and much of the rest of the country—have called for moving to an open primary with a top-two or top-four general election in order to broaden participation across the electorate. In the coming months, Commission staff recommend that the Commission carefully consider whether to advance one or both of these proposals to voters.
New York State has signaled a growing interest in improving voter participation in recent years. In 2019, New York State combined state and federal primaries.12 A law enacted in 2022 relaxed voter registration deadlines from 25 to 10 days prior to elections, reducing a considerable obstacle to voting.13 A series of measures passed in 2023 bolstered absentee ballot and mail-in voting access, streamlined early-voting protocols, improved electoral education efforts at local correctional facilities and schools, and developed a robust training program for poll workers.14 The State also passed legislation moving town and village elections outside New York City to even-years as part of a broader package of election reforms intended to improve voter turnout.15
At the local level, in 2019 New York City voters approved a significant change to the way the City’s elections are conducted: ranked choice voting (RCV). Beginning in 2021, RCV is now used for primary and special elections. RCV permits voters to rank up to five candidates in order of preference. If no candidate receives a majority of first-choice votes in the first round, then the candidate with the fewest first-round votes is eliminated. Voters who cast their first-round votes for the eliminated candidate then have their votes transferred to any next-ranked choice among candidates that have not been eliminated. This process continues until a single candidate has a majority of votes.16
Until recently, elections in New York City were largely decided by a plurality system (“first-past-the-post”), as is common across much of the country. Certain high-profile citywide posts—including Mayor, Comptroller, and Public Advocate—used a distinct, hybrid approach in which the top two primary performers would progress to a run-off election if neither won over 40% of the vote.17
New York City’s transition to RCV in 2021 was expected to save time and money by allowing primary voters to select winning candidates without having to participate in separate, costly run-off elections. Perhaps even more consequentially, RCV aimed to encourage voters to select their preferred candidates, rather than cast their votes strategically in order to block undesirable candidates from winning. Similarly, RCV allowed voters to support comparable candidates simultaneously instead of dividing their support and inadvertently improving the chances of alternative, less desirable candidates. RCV was also expected to incentivize candidates to broaden their bases of support and abstain from adversarial campaigning strategies.18
As the League of Women Voters of the City of New York testified to the Commission, the early results from RCV are encouraging.19 The 2021 mayoral primary elections saw 26.5% of eligible New Yorkers turn out to vote, making it the mayoral primary with the highest turnout in decades.20 88.3% of voters ranked more than one candidate in at least one race21 with 89.3% of Democrats and 56.6% of Republicans ranking multiple candidates.22 46.2% of Democrats utilized all five of their ranks in the mayoral contest, and just 13% ranked only one candidate.23 Rates of ballot error were also much lower in the 2023 primary cycle than in 2021, suggesting that the public has become increasingly comfortable with the mechanics of RCV.24
Given these promising early results, any proposed election reforms should preserve RCV and build on its success.

Areas to Explore
The Commission has received thoughtful input from elected officials, policy makers, academics, activists, and other members of the public. Their suggestions fell into two major categories: even-year elections and open primaries.
Even-Year Elections
Local elections in New York City are generally held in odd-numbered years that do not coincide with other state-wide or national races, yielding significantly lower turnout than even-year elections. 53% of registered voters cast a ballot in the 2024 presidential election, while just 23% voted in the 2021 mayoral election.25 Indeed, turnout in the last three general elections for city office hovered between 23% and 26% of all registered voters, while turnout in the last three presidential general elections was between 53% and 62%—more than twice as high.

Voter turnout is consistently higher in municipalities with even-year elections. According to a study by Citizens Union,
“The six largest U.S. cities that hold local elections in odd-numbered years see average mayoral turnouts of 10% to 38%, while the six largest cities that have their elections in even-numbered years see average mayoral turnouts that range between 50% and 75%.”26 For example, compared to the 23% of registered voters who participated in the 2021 New York City mayoral election, 44.9% voted in Los Angeles’s 2022 mayoral election, and 78.9% voted in San Francisco’s 2024 mayoral election.27
Other cities have experienced significant increases in voter participation by synchronizing their local elections with presidential elections. Just 21% of registered voters participated in Phoenix’s final odd-year mayoral election, whereas 77.4% voted in the first even-year election in 2020 (a 266% increase) and 76.8% voted in 2024.28 Likewise, turnout in Baltimore skyrocketed from 13% of registered voters in 2011 to over 60% after the city transitioned to even-year elections in 2016 (a 361% increase).29
Comparisons within New York City further support the conclusion that a shift to even-year elections would boost turnout. Turnout in State Assembly races, which occur in even-years, is often higher than in City Council elections in odd-years. For example, in 2023, City Council District 13 had a competitive election and turnout of approximately 13% of registered voters.30 By contrast, the 2024 election in the mostly overlapping Assembly District 82 had 56% turnout.31 Turnout was also higher in the 2022 gubernatorial even-year election in AD 82 at 34%.32 A similar phenomenon can be noted in City Council District 47, where turnout was approximately 20% in a competitive 2023 general election, much lower than the 56% turnout rate in the 2024 general election for the largely overlapping Assembly District 46.33
The Brennan Center for Justice, Citizens Union, Common Cause, Councilmember Gale Brewer, and others testified to the Commission in favor of shifting local elections to even-years in order to promote broader voter participation.34 Supporters of shifting to even-years also emphasize the benefits for electoral participation among historically disadvantaged groups. As the Brennan Center for Justice testified to the Commission, “[e]lections in odd-numbered years also exacerbate disparities in participation for voters who have historically faced barriers to the franchise, including voters of color and young voters...moving municipal elections to even-numbered years can make the city’s democracy more inclusive.”35
But proponents argue that increased turnout is not the only benefit.
Even-year elections would likely save taxpayer dollars. Odd-year races require cities and states to organize elections on an annual basis. Consolidated even-year schedules reduce the frequency of local elections, saving administrative time and public funds that can be reallocated to voter communication and outreach efforts. In New York City, an estimate by the Independent Budget Office suggests that the savings would total approximately $42 million every two years—equal to nearly the Department of City Planning’s entire Fiscal 2026 budget ($46,736,000).36 Although savings might be limited by the need to administer county-based judicial and district attorney elections in odd-years, such elections cost significantly less than those for municipal offices.37 Moreover, a move to enable even-year city elections could encourage state-law changes to the election cycle for these positions as well.
Even-year local elections could also reduce the number of special elections in New York City, which arise when sitting elected officials run for and win other positions, forcing vacancies for their previous seats mid-term. The current election schedule enables sitting elected officials to run for offices on another election cycle while holding onto their existing role. When they win, it prompts a special election. Special elections can cost hundreds of thousands or millions of dollars, are prone to particularly low turnout, and leave positions vacant and constituents without representation for extended periods of time.38
Elsewhere in the country, when voters are given the opportunity to move to even-year elections, they overwhelmingly support such efforts. Election consolidation measures have passed by over 70% in Los Angeles, Phoenix, and Austin.39 In fact, Citizens Union’s 2022 report on even-year elections found “no case nationally in which voters have voted down a proposition to consolidate local elections.”40
A shift to even-year elections would likely require changes to both local and state law. The New York City Charter establishes that elections for Public Advocate, Borough Presidents, and Comptroller must occur concurrently with the mayoral election.41 Elections for City Council members are generally held every four years, at the same time as the mayoral election.42 State Municipal Home Rule Law Section 23 subjects local changes to the terms of elective offices to mandatory referendum that must be approved by the voters.43 At the same time, Article XIII Section 8 of the New York State Constitution requires that all city officers be elected in odd-numbered years.44
The prospect of state-law reform may be promising. In recent years, there has been considerable momentum behind transitioning to even-year elections across New York State. In 2023, the Legislature and Governor passed legislation to move many village and town elections to even years.45 In 2024, a state-wide constitutional amendment that would give New York City the option to move its local elections to even-years passed the State Senate, but that state constitutional amendment would still require an additional citywide referendum approved by New York City to opt in and make the change.46
As Councilmember Brewer testified, a Charter amendment could remove local-law rules requiring odd-year elections and establish new rules to govern even-year elections that would come into effect should the State Constitution give New York City the power to move to even-year elections.
In contemplating potential Charter amendments to move to even-year elections, the Commission may consider a number of issues. First, the Commission may consider whether the need for additional state action—namely, a state-wide referendum on a state constitutional amendment—should deter Charter changes at this time.47 The Commission may also consider whether the appropriate even-year cycle would be a presidential year, during which turnout is typically highest, or a gubernatorial cycle. And the Commission may consider how best to effectuate a transition from odd- to even-year elections, given that any change will involve a one-time disruption to elected officials’ terms, which would either be longer or shorter than anticipated.
The Commission may consider whether aligning local elections with gubernatorial or presidential elections could detract from focus on local elections—a common justification for odd-year elections. The Commission must also carefully consider the impact of any proposed change on minority and marginalized communities. On this score, an analysis by the Harvard Law School Election Law Clinic suggests that the current system of odd-year elections “dilutes the voices of Black and Brown voters and young voters” in New York, and argues that a change to even-year elections would “decrease age and racial disparities in political participation, help make local democracy more inclusive, and City government more representative.”48
The Commission may also consider the extent to which moving local elections to even-years may lead to more complex ballots and voter fatigue and confusion. According to reports by Citizens Union and Professor Christopher R. Berry of the University of Chicago, while evidence suggests that lengthier ballots do result in some “voter roll off”—that is, voters failing to complete their ballots—this effect is significantly outweighed by the number of additional voters participating in even-year elections.49

Open Primaries
Another cause of low participation in local elections may lie in the structure of our primary and general elections. New York City currently uses a “closed primary” system (with RCV) followed by a general election. In a closed primary, voters must be registered with a specific party to vote in that party’s primary.50 As a result, more than 1 million unaffiliated51 New York City voters—those who are not registered as a member of any officially recognized political party—are excluded.52
Party enrollment deadlines, set far in advance of the primary election, also serve as a barrier to participation. Returning voters must change their party enrollment by February 14th in order to be eligible to vote in a different party’s primary that year.53 By contrast, voters registering for the first time have until ten days before the primary to register and be eligible to vote in that year’s primary.54
Jurisdictions throughout the U.S. run their primaries differently. In many states, party affiliation does not limit voters’ choices in primary elections. In some states, voters can choose which party’s primary to vote in without being registered as members of that party.56 This system is used in Texas, Georgia, and Michigan.55 Other jurisdictions allow unaffiliated voters to participate in partisan primaries. In Connecticut, political parties themselves can choose whether to allow unaffiliated voters to vote in their primaries.57 In Colorado, parties must allow unaffiliated voters—though not voters affiliated with other parties—to vote in the primary election of their choosing.58
Other states use “top two,” “top four,” or “jungle” primary election systems, which refer to primary elections in which candidates from all parties are listed on a single ballot. In a top-two primary system, the two candidates with the most votes advance to the general election; in a top-four system, the four candidates with the most votes advance to the general election. In these systems, some states list the party affiliations of candidates on the ballot, whereas others do not identify party on the ballot at all. California and Washington both use a top-two system, Alaska uses a top-four system, and Louisiana and Nebraska employ similar variations.59
New York City already has experience with open elections, as special elections to fill vacancies are conducted without partisan primaries. In 1988, New York City voters overwhelmingly adopted Charter revisions to conduct special elections to fill vacancies in this manner, rather than through appointment or succession.60 The new special election process provided that empty positions would be “filled temporarily...at specially called elections, with nominations by independent nominating petitions [without] party designations.”61 In such elections, traditional parties are not used to designate candidates; instead, candidates use new party lines.62
Several Charter Revision Commissions have considered whether to propose open primaries. A top-two system was previously presented to the voters by the 2003 Charter Revision Commission, and it was rejected by a margin of ~70% in opposition to ~30% in favor.63 The 2003 Commission had proposed a top-two system to address a wide range of issues with the City’s electoral system.64 The Commission’s final report argued that closed primaries disenfranchised independent voters, created a low threshold for victory, narrowed debate on policy issues, protected incumbents, and incentivized voters and candidates who did not align with a political party to participate in that party’s primary.65 Under the 2003 Commission’s proposal, candidates’ party affiliation would be listed on the primary ballot to preserve the important role of parties in signaling to voters candidates’ policy positions.66 Opponents of the 2003 open primaries proposal argued that the change would make it easier for wealthy candidates to get elected and harder for minority candidates to get elected.67 Ultimately, voters rejected the change.
Since 2003, subsequent Charter Revision Commissions have examined similar electoral reforms. The 2010 Commission noted that the landscape of support had changed significantly since the proposal was rejected in 2003—good government groups including Citizens Union that had previously opposed the 2003 proposal had since come out in support of a top-two system, in part because of declining voter turnout.68 But the 2010 Commission also highlighted research from the 2003 Commission that reported an inconclusive impact of such a system on turnout.69 And the 2010 Commission received notable testimony in opposition, including a letter from the NAACP Legal Defense and Education Fund citing concerns on the proposal’s impact on minority voters.70 The 2010 Commission ultimately did not propose any changes, opting to include other election administration reforms instead.71 In 2024, the Commission considered different variations of open primaries, including top two, but concluded that the question should be deferred to a future Commission in light of the recent implementation of RCV.72
The Commission has heard testimony from many New Yorkers calling for open primaries. One notable proposal has been put forward by Citizens Union: an open primary, with RCV, followed by a top-two general election.73 In Citizens Union’s proposal, RCV would be used at the primary stage to select the top two candidates to advance to the general election, and party affiliation would remain on the ballot as an important source of information for voters.74 A similar model is used in Washington and for state-wide offices in California, although these jurisdictions do not use RCV.75 Seattle voters recently passed a referendum to add RCV to city races; starting in 2027, Seattle will have a system with both top-two and RCV.76 No city currently uses both RCV and top two at the same time in municipal elections. But Assemblymember Robert Carroll of Brooklyn has introduced state legislation that would establish such a system for local, state, and federal offices in New York.77
There are other variations on the top-two system that advance more candidates to the general election and use RCV. For example, Alaska has a top-four system.78 In the primary, all candidates are listed on the same ballot with their party registration, and voters vote for one candidate in each race. The four candidates with the most votes move on to the general election, which is conducted with RCV. Preliminary research indicates that Alaska’s top-four system with RCV resulted in higher turnout and increased electoral competition in the state’s first top-four primary in 2022.79
There are several potential benefits to implementing an open primary in New York City. Research has shown that open primaries, including top two, increase electoral competition and encourage candidates to appeal to a broad cross-section of voters.80 This system would promote the participation of unaffiliated voters. And it would reduce the negative impact of registration deadlines, which reduce participation and lead some candidates to spend significant time and energy registering voters in a political party rather than discussing local issues.81
An open primary could also increase the likelihood of competitive general elections, with two candidates who had both received significant support in the primary advancing to a head-to-head race.

In our current system, while Democratic primary elections are often highly competitive, the winners are heavily favored to win general elections by significant margins. For example, in 2021, Curtis Sliwa won the Republican mayoral primary election with ~41,000 votes and consequently advanced to the general election ballot.82 But Sliwa received far fewer first-round votes than four candidates who were eliminated in the Democratic primary election: Scott Stringer (~52,000 votes), Andrew Yang (~115,000 votes), Kathryn Garcia (~184,000 votes), and Maya Wiley (~200,000 votes).83 The resulting 2021 general election was not competitive: Sliwa lost to now-mayor Eric Adams by a margin of more than 2-1.84 In a top-two system with RCV, the 2021 general election may well have been different. While there is no way to know for certain how that contest would have played out with an open primary, if the 2021 general election had featured the top-two vote getters across all party primaries, the November race would have featured now-Mayor Eric Adams and Kathryn Garcia.85
An open primary that employed RCV would also address an arguable gap in New York City’s current system: today, while ranked choice voting applies in primary elections, it does not apply in the general election. As a result, in a fragmented general election field with multiple candidates, it is now possible for a candidate with a small share of support in the electorate to prevail. An open primary with top-two system would ensure that the two candidates who proceed to a general election emerge from a RCV primary, and that whoever prevails in the general election has garnered broad support. Indeed, a staff analysis of all jurisdictions with RCV could not find another locality (aside from New York City) that uses RCV in a closed primary.86
In contemplating potential Charter amendments to move to open primaries, the Commission may consider a number of issues.
The Commission may wish to compare the potential benefits of an open primary with top-two system, as Citizens Union has proposed, with alternatives like Alaska's top-four system. The Commission may also consider the likely effect of any shift on voter participation. While New York City’s current system discourages participation by unaffiliated voters, experts note that despite California’s top-two system possibly leading to increased voter engagement among independents,87 there has been no substantial increase in voter turnout or participation in primary or general elections in the 14 years following the state’s move to a top-two system.88


The Commission may also wish to consider the effect of reform on the role of political parties in New York City’s electoral system. Opponents of open primaries argue that political parties should maintain influence over how party nominees are selected, and they argue that open primaries will weaken parties’ ability to foster democratic participation and advance policy priorities.89 That said, given the important organizing and signaling functions that parties continue to play in public life, any move to open primaries can preserve party identification on the ballot.
The Commission should also evaluate whether it is too soon after the adoption of RCV to suggest a further significant change to the voting process. There has only been one mayoral election run with RCV since the 2019 amendment adding RCV was adopted. Given that voters may still be adjusting to the present use of RCV, it may be appropriate to delay adopting additional election system reforms, like a top-two or top-four system, to allow more time to study the impact of RCV, as well as to avoid voter confusion. As already stated, however, any move to open primaries can preserve and build upon the success of RCV.
Additionally, the Commission must carefully consider the impact of any proposed change on minority and marginalized communities. This issue was heavily discussed in the 2003 Commission’s final report, which concluded that although some academic evaluations have asserted that open primaries could contribute to the under-representation of minorities, there is substantial evidence suggesting that open primary systems actually bolster Black and Hispanic candidates’ performances at the polls, in addition to empowering minority voters more broadly.90 A case study by the 2003 Commission found that in Jacksonville, Florida, which adopted a “unitary” primary system91 by referendum in 1992, Black candidates fared better than they had previously in partisan elections and there was no indication of negative impacts on minority voters.92 The Commission’s conclusions were bolstered by an analysis which found that the proposed changes would not violate the Voting Rights Act because they would “not result in a retrogression of opportunity for minorities to participate fully in the political process and elect their preferred candidates.”93
Although the 2003 Commission’s analysis suggested the change would benefit communities of color, more than twenty years have passed since the Commission's analysis was conducted and this Commission must freshly consider how any proposed reform might impact minority and marginalized communities. Proposed election reforms must also be assessed for consistency with the New York Voting Rights Act and may be subject to preclearance review by the New York Attorney General’s Office for an analysis of the impact of these changes on racial and language minority groups.94

References
1. Board of Elections in the City of New York, Annual Report 2022, at 40.
2. Board of Elections in the City of New York, NYS Voter Enrollment by County, Party Affiliation and Status: Voters Registered as of February 2025; NYC Campaign Finance Board, Voter Analysis Report: 2021 - 2022, Apr. 29, 2022, at vi.
3. Board of Elections in the City of New York, 2023 Primary Election Official Ranked Choice Rounds: DEM Council Member 43rd Council District, July 18, 2023.
4. Board of Elections in the City of New York, New York City Board of Elections Council District Summary Report as of 2/21/2023, Feb. 2023, at 31. To calculate registered voters, Commission Staff examined all registered voters, including “inactive” voters and conducted the following analysis: Total voting-age residents = Total population – Total persons Under 18 years. Department of City Planning, Census Demographics at the NYC City Council district (CNCLD) level.
5. Board of Elections in the City of New York, Annual Report 2022, at 40-41.
6. NYC Campaign Finance Board, Voter Analysis Report: 2023, Apr. 29, 2024, at 2.
7. See NYC Campaign Finance Board, Voter Analysis Report: 2021-2022, Apr. 29, 2022, at vi; NYC Campaign Finance Board, 2023 Voter Analysis Report, at 18; Zoltan Hanjal and Jessica Trounstine, “Where Turnout Matters: The Consequences of Uneven Turnout in City Politics,” (May, 2005) The Journal of Politics, Vol. 62, No. 2 at 525; Id. at 528; Betsy Gotbaum and Ben Weinberg, “Opinion: New York City Should move its municipal elections to even-numbered years,” June 7, 2023.
8. NYC Campaign Finance Board, Voter Analysis Report: 2023, Apr. 29, 2024, at 18.
9. NYC Campaign Finance Board, Voter Analysis Report: 2021-2022, Apr. 29, 2022, at vi.
10. Id. at 46; The Furman Center, “Neighborhood Profiles,” May 21, 2024.
11. Id.
12. 2019 N.Y. Laws ch. 5; Election Law § 8-100(1)(a); Election Law § 5-507 (authorizing young people to pre-register to vote).
13. 2022 N.Y. Laws ch. 765; Election Law § 5-210(3).
14. New York State Governor’s Office, “Governor Hochul Signs Legislative Package to Strengthen Democracy and Protect Voting Rights.
15. 2023 N.Y. Laws ch. 741. This law is the subject of active litigation. See Onondaga v. State, 222 N.Y.S.3d 342 (Sup. Ct. 2024).
16. Charter § 1057-g.
17. NYC Campaign Finance Board, Runoff Guidance Document, Dec. 8, 2014, at 1.
18. 2024 Charter Revision Commission, Adopted Final Report, (Jul. 2024), at 70-71; 2019 Charter Revision Commission, Final Report, (Aug. 2019) at 27-29.
19. League of Women Voters of New York, Best Practices for New York City Elections (Apr. 9, 2025) (written testimony).
20. NYC Campaign Finance Board, Voter Analysis Report: 2021-2022, at vi.
21. Id. at 2.
22. The 2021 Republican mayoral primary only featured two candidates (with an option to write in a third), so the fact that Republican voters ranked multiple candidates at a lower rate than Democratic voters does not indicate a partisan divide in the utilization of RCV. Id. at 7.
23. Id.
24. Deb Otis of FairVote, What We Learned From New York City’s Second Ranked Choice Voting Election, Jan. 9, 2024.
25. The 2024 turnout percentage was calculated by dividing the number of total ballots cast by the number of total registered voters in the city as of Nov. 1, 2024, and this same calculation was used for the below table. New York State Board of Elections, Enrollment by County, Voters Registered by County as of 11/01/2024; NYC Board of Elections, Statement and Return Report For Certification, General Election 2024; NYC Board of Elections, Annual Report 2022.
26. Citizens Union, Policy Report: Moving Municipal Elections to Even-Numbered Years, Dec. 2022, at 1.
27. Los Angeles County Registrar-Recorder/County Clerk, Los Angeles City Mayoral General Election 2022; Los Angeles County Registrar-Recorder/County Clerk, Votes Cast by Community, General Election 2022; San Francisco Department of Elections, November 5, 2024 Election Results (Final); NYC Board of Elections, Annual Report 2022.
28. City of Phoenix, City Election Results, 2024, 2020, and 2015.
29. Citizens Union, Policy Report: Moving Municipal Elections to Even-Numbered Years, Dec. 2022; Baltimore Board of Elections, Statement of Votes Cast, Baltimore City General Held November 8, 2011, SOVC For Jurisdiction Wide, All Counters, All Races; Baltimore Board of Elections, Jurisdiction Wide Summary, 2016 Presidential General Election.
30. NYC Board of Elections, Statement and Return Report For Certification, General Election 2023; NYC Board of Elections, Council District Summary Report As of 2/21/2023.
31. NYC Board of Elections, Council District Summary Report As of 2/21/2023; New York State Board of Elections, Voter Enrollment by Assembly District.
32. Citizens Union, Policy Report: Moving Municipal Elections to Even-Numbered Years, Dec. 2022.
33. NYC Board of Elections, Council District Summary Report As of 2/21/2023; NYC Board of Elections, Statement and Return Report For Certification, General Election 2024 - 11/05/2024, Kings County - All Parties and Independent Bodies; New York State Board of Elections, Voter Enrollment by Assembly District.
34. Ben Weinberg, Director of Public Policy at Citizens Union, Queens Hearing (Feb. 24, 2025) (testimony) at 105-109; Susan Lerner, Executive Director of Common Cause, Queens Hearing (Feb. 24, 2025) (testimony) at 109-113; Marina Pino, Counsel, Elections & Government at the Brennan Center for Justice at NYU School of Law, Staten Island Hearing (Apr. 15, 2025) (testimony); John Ketcham, Staten Island Hearing (Apr. 15, 2025) (testimony); Gale Brewer, Councilmember, Testimony Before the New York City Charter Revision Commission, (Apr. 23, 2025) (written testimony).
35. Marina Pino, Counsel, Elections & Government at the Brennan Center for Justice at NYU School of Law, Comment on the Effect of Moving Municipal Elections to Even-Numbered Years (Apr. 15, 2025) (written testimony).
36. Independent Budget Office, Fiscal Impact of Even-Year Elections, Aug. 2024; Mayor’s Office of Management and Budget, Expense Budget, Agency Budget Forecast, Department of City Planning.
37. Citizens Union, Policy Report: Moving Municipal Elections to Even-Numbered Years, Dec. 2022, at 44.
38. Keith Williams, “The Odd Timing of City Elections in New York,” The New York Times, Sep. 7, 2017. See 2019 Special Public Advocate election (~$15M – $23M), Rich Calder, “Here's how much NYC’s public advocate election will cost taxpayers,” The New York Post, Jan. 2, 2019; 2010 City Council Brooklyn special election ($350,000), Clyde Haberman, “Leaving Office Early, at a Cost to Taxpayers,” The New York Times, Mar. 18, 2010; Rachel Holliday Smith, “Eric Adams ‘Troubled’ By Unfilled Brooklyn Seats, Including His Former Post,” DNA Info, Apr. 24, 2014; Colin Campbell, “Cuomo Not Eager to Call Special Elections,” Observer, Jan. 17, 2014.
39. Citizens Union, Policy Report: Moving Municipal Elections to Even-Numbered Years, Dec. 2022, at 46.
40. Id.
41. Charter § 24(a) (Public Advocate); Charter § 81(b) (Borough Presidents); Charter § 91 (Comptroller).
42. The Charter provides for a shortened two-year term every 20 years in order to coordinate City Council terms after a redistricting. See Charter § 25(a).
43. Mun. Home Rule § 23.
44. New York State's practice of holding off-cycle elections originates from an 1894 constitutional amendment, which followed several decades during which the city had flipped multiple times between on- and off-cycle elections. Progressives hoped that through this reform they might curb the dominance of the Tammany Hall political machine during national races, but their success in doing so was mixed. See Keith Williams, “The Odd Timing of City Elections in New York,” The New York Times, Sep. 7, 2017; New York State Constitution art. XIII § 8.
45. 2023 N.Y. Laws ch. 741. This legislation did not change New York City’s election cadence and is subject to a legal challenge. See Onondaga v. State, 222 N.Y.S.3d 342 (Sup. Ct. 2024).
46. New York State Senate Bill S9826 (2024); Mun. Home Rule § 23(2)(e).
47. League of Women Voters of New York, Best Practices for New York City Elections (Apr. 9, 2025) (written testimony).
48. Harvard Law School Election Law Clinic, Testimony to Committee on Governmental Operations, State & Federal Legislation of the New York City Council, Dec. 3, 2024.
49. Citizens Union, Moving Municipal Elections to Even-Numbered Years, Dec. 2022, at 2, 5-6, 29-31; Christopher R. Berry, The Timing of Local Elections, Jan. 2025.
50. Board of Elections in the City of New York, About NYC Elections.
51. Unaffiliated voters are also sometimes referred to as “blanks,” as they are denoted in enrollment tallies as those who left party affiliation blank.
52. Citizens Union, Charter Reforms for Better New York City Government, Feb. 2025, at 2.
53. Board of Elections in the City of New York, Party Affiliation; Election Law § 5-304.
54. New York State Board of Elections, Registration and Voting Deadlines. Prior to 2019, State election law required voters to change their party enrollment approximately nine months in advance. See Rebecca Klar, “New York makes it easier to change parties before primary,” The Hill, Sep. 26, 2019; Election Law § 5-210.
55. National Conference of State Legislatures, State Primary Election Types, Feb. 6, 2024.
56. Id.
57. Id.
58. Id.
59. Id.
60. 1988 Charter Revision Commission, Report of the New York City Charter Revision Commission: Volume One, (Jan. 1989), at 24 and 40.
61. Id. at 41. For more information detailing the process for filling vacancies by special election for councilmembers, see Charter § 25(b).
62. See Apr. 29, 2025 NYC 51st Council District special election, featuring independent party labels such as “We The People,” “Common Ground,” and “SI Patriotism.” Board of Elections in the City of New York, The Contest List: Special Election 51 City Council - 04/29/2025, Mar. 6, 2025.
63. 2003 Charter Revision Commission, 2003 Ballot Questions; Jonathan P. Hicks and Michael Cooper, “The 2003 Election: City Charter; City Votes Down an Effort to End Party Primaries,” The New York Times, Nov. 5, 2003.
64. 2003 Charter Revision Commission, Enhancing Access, Opportunity, and Competition: A Blueprint for Reform, (Sep. 4, 2003).
65. Id. at 30-33.
66. Id. at 49-51.
67. NYC Campaign Finance Board, 2003 General Election Voter Guide; Jonathan P. Hicks and Michael Cooper, “The 2003 Election: City Charter; City Votes Down an Effort to End Party Primaries,” The New York Times, Nov. 5, 2003.
68. 2010 Charter Revision Commission, Final Report of the 2010 New York City Charter Revision Commission, (Aug. 23, 2010) at 65.
69. Id. at 66.
70. Id. at 68. See Michael Barbaro, “Renewed Fight Looms Over Ending Role of Political Parties in Elections,” The New York Times, May 13, 2010.
71. 2010 Charter Revision Commission, 2010 Ballot Questions, (Aug. 23, 2010).
72. 2024 Charter Revision Commission, 2024 Charter Revision Commission Adopted Final Report, (Jul. 25, 2024) at 69-75.
73. Citizens Union, Charter Reforms for Better New York City Government, Feb. 2025, at 3.
74. Id. See Kenneth Sherrill, “The dangers of non-partisan elections to democracy,” (1998) Social Policy Magazine, vol. 28, no. 4; Russell Muirhead, Nancy L. Rosenblum, “The Political Theory of Parties and Partisanship: Catching Up,” (2020) Annual Review of Political Science, vol. 23.
75. California Secretary of State, Elections and Voter Information, Political Parties, No Party Preference Information, Top Two Candidates Open Primary Act and Voter-Nominated Offices; Washington Secretary of State, Top 2 Primary: FAQs for Candidates.
76. King County Department of Elections, Ranked Choice Voting in Seattle; Seattle Municipal Code § 2.18.020.
77. New York State Assembly Bill A00090 (2025).
78. Alaska Division of Elections, Election Information, Ranked Choice.
79. Todd Donovan, Caroline Tolbert, and Nathan Micatka, “Composition of the Electorate in Alaska’s Top-four Nonpartisan Primary Compared to the Partisan Primary,” (Feb. 9, 2025) Representation; Ryan Williamson, Evaluating the Effects of the Top-Four System in Alaska, Jan. 2023.
80. See Citizens Union, Charter Reforms for Better New York City Government, Feb. 2025.
81. Jonathan Custudio, Harry Siegel, “Socialists, Zionists Race to Register New Democrats Ahead of Friday Deadline,” The City, Feb. 12, 2025.
82. NYC Board of Elections, 2021 Primary Official Ranked Choice Rounds.
83. NYC Board of Elections, 2021 Primary Official Ranked Choice Rounds.
84. NYC Board of Elections, Statement and Return Report for Certification, General Election 2021 - 11/02/2021, Crossover, All Parties and Independent Bodies, Mayor (Citywide), Nov. 2021.
85. The above vote tallies are from the first round, not the final round. Although Wiley outperformed Garcia in the first round, Wiley was eliminated after the seventh round. Garcia went on to receive 397,316 votes in the eighth and final round. See NYC Board of Elections, 2021 Primary Official Ranked Choice Rounds.
86. Note that until 2024, Maine used RCV in closed primaries. However, Maine changed to a “semi-open” primary in 2024, allowing unenrolled voters to chose which party’s primaries to vote in. See Kevin Miller and Steve Mistler, “What to know about Maine’s primary elections ahead of Super Tuesday,” Maine Public Radio, Mar. 1, 2024; Ranked Choice Voting Resource Center, Where is RCV Used (Mar. 2024); National Conference of State Legislatures, State Primary Election Types, Feb. 2024.
87. California Secretary of State, Historical Voter Registration and Participation in Statewide General Elections 1910-2024; California Secretary of State, Historical Voter Registration and Participation in Statewide Primary Elections 1914-2024; Public Policy Institute of California, Top-Two Primary Engages Independents - Despite Low Turnout Overall.
88. California Secretary of State, Historical Voter Registration and Participation in Statewide General Elections 1910-2024; Public Policy Institute of California, Top-Two Primary Engages Independents - Despite Low Turnout Overall, Apr. 30, 2014; Dan Walters, “California made primary elections boring. Voter participation reflects that,” Cal Matters, Feb. 29, 2024.
89. See John S. Jackson, “The American Political Party System: Continuity and Change Over Ten Presidential Elections,” (2015) Brookings Institution Press; Gerald M. Pomper, Passions and Interests: Political Party Concepts of American Democracy (University Press of Kansas, 1992), at 132-150.
90. 2003 Charter Revision Commission, Enhancing Access, Opportunity & Competition: A Blueprint for Reform, Final Report, (Sep. 4, 2003) at 22, 23, 26, and 39.
91. A unitary primary includes all candidates on a single primary ballot with party labels. If a candidate wins a majority of the votes, they are elected to that office and no further election is held. If no candidate receives a majority, the two top vote-getters proceed to the general election.
92. 2003 Charter Revision Commission, Enhancing Access, Opportunity & Competition: A Blueprint for Reform, Final Report, (Sept. 4, 2003) at M5-M6.
93. 2003 Charter Revision Commission, Enhancing Access, Opportunity & Competition: A Blueprint for Reform, Final Report, (Sept. 4, 2003) at 26-27; Allan J. Lichtman, Professor of History at American University, The Voting Rights Implications of Nonpartisan Citywide, Borough President, and City Council Elections and Nonpartisan Succession Elections for Mayor in the City of New York, Aug. 2003.
94. Election Law § 17-210.